
Inside the Wazuh Agent: One Sensor, Every Operating System, and What It Actually Collects
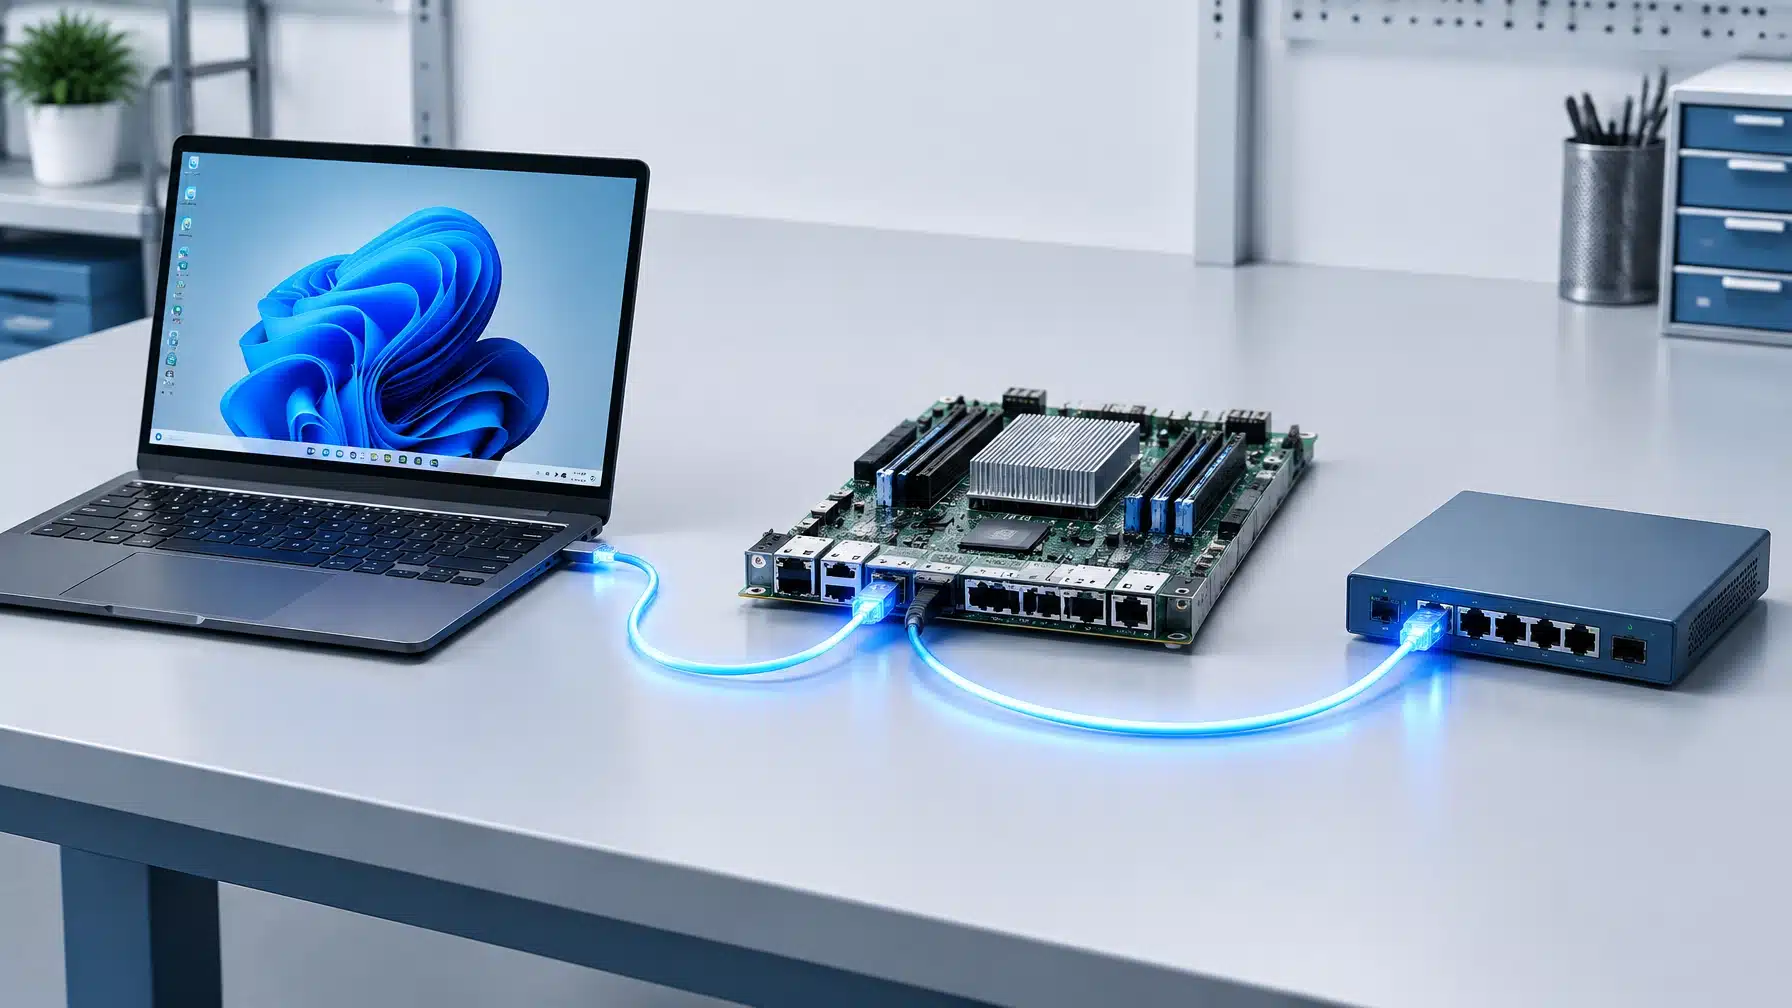
A security agent is useful only if it fits the environment you actually have. That means Windows endpoints alongside Linux servers, macOS workstations, virtual machines, containers, cloud services, and network equipment that cannot run an agent at all.
Wazuh is designed for this kind of mixed estate. Its agent runs across multiple operating systems and gathers more than logs, but it is not a universal sensor. Understanding what it sees, how it connects, and where it needs help is essential to building reliable monitoring.
ONE AGENT, MULTIPLE PLATFORMS
Wazuh agents are available for Linux, Windows, macOS, Solaris, and AIX, among other platforms. They can run on workstations, servers, virtual machines, cloud instances, and some container environments. The agent is modular, so teams can configure the collection and monitoring features that fit each system and its role.
The basic flow is straightforward:
- The agent collects configured endpoint data.
- The Wazuh server analyzes incoming events and applies rules.
- The Wazuh indexer stores and indexes data.
- The dashboard provides views for investigation and operations.
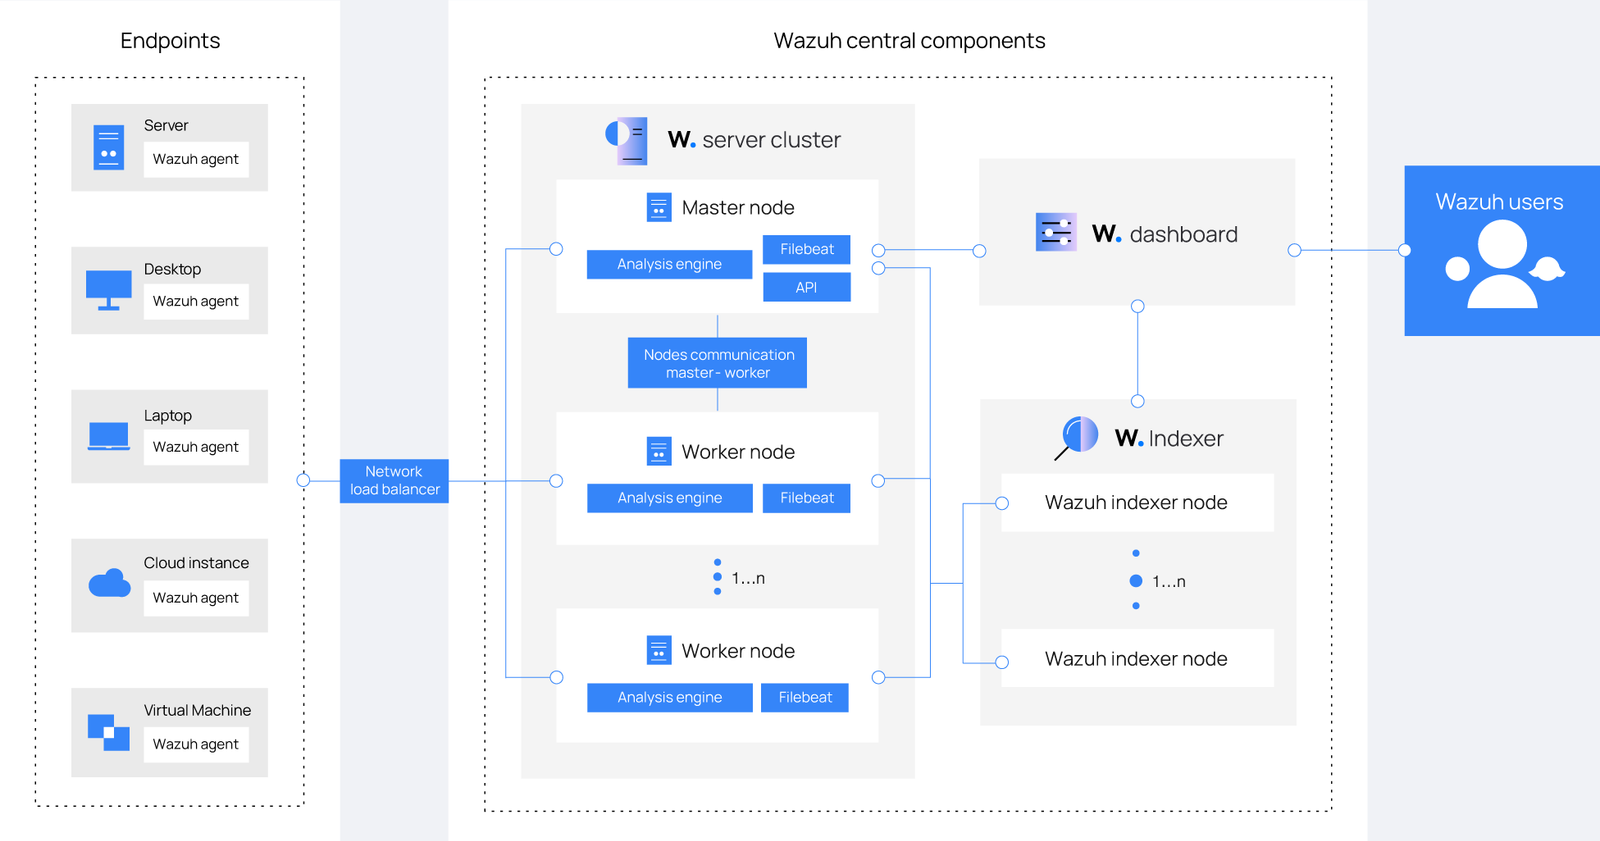
For a small environment, Wazuh can run as an all-in-one deployment. Larger environments can distribute server and indexer components across multiple nodes to support higher event volumes and availability requirements. Agents can connect to a server cluster through failover configuration or a load balancer, which helps distribute connections and gives agents another server node to reach if a worker becomes unavailable.
See the Wazuh architecture documentation for deployment models and component roles.
WHAT THE AGENT ACTUALLY COLLECTS
The Wazuh agent is more than a log shipper. Its modules can provide several kinds of security and operational telemetry, depending on configuration:
- Logs: Operating system and application events, including Windows events and supported log files.
- File integrity monitoring (FIM): Changes to monitored files, including creation, deletion, content changes, permissions, and ownership.
- Software inventory: Information about installed applications and packages. Wazuh’s vulnerability detection uses inventory data to identify software that may be affected by known vulnerabilities.
- Security configuration assessment (SCA): Results from checks based on security benchmarks or custom policies.
- System inventory: Details such as operating system version, network interfaces, running processes, installed software, and open ports.
- Additional signals: Depending on modules and configuration, the agent can also support malware and rootkit detection, authorized command output collection, and active response actions.
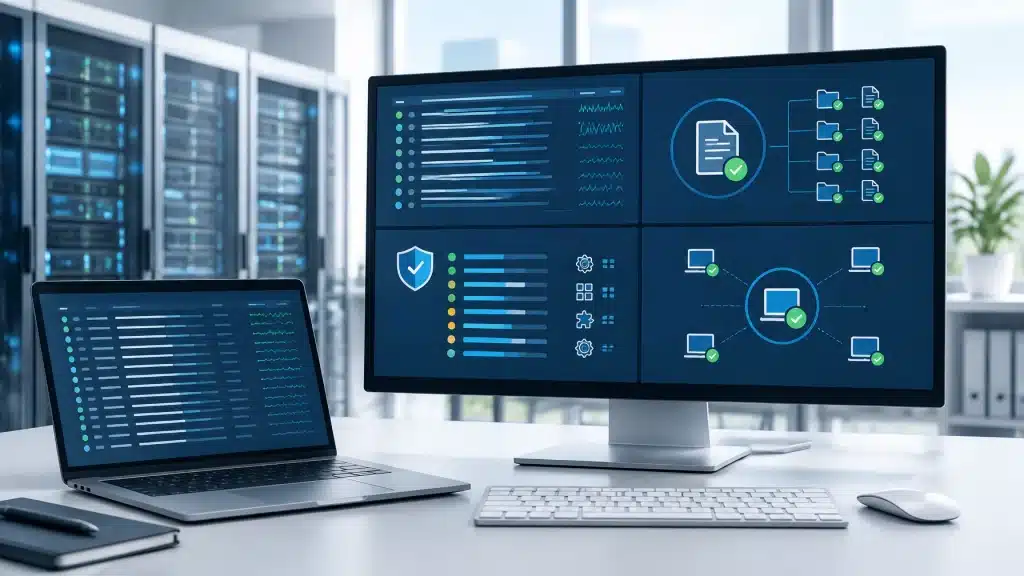
This wider view matters. A log can record that something happened; inventory and configuration data help establish which system was involved, what software it runs, and whether its security posture meets expectations.
But collection is not automatic just because an agent is installed. Modules need to be configured, policies need to match the endpoint’s purpose, and collected data needs to be reviewed and retained appropriately. For example, monitoring every frequently changing directory with FIM can produce excessive events. Coverage and tuning are design decisions, not installation defaults to ignore.
CONNECTIONS, ENROLLMENT, AND EVENT BUFFERING
By default, agents send events to the Wazuh server over TCP port 1514. New agents typically enroll through TCP port 1515; enrollment using the Wazuh server API can use TCP port 55000. These ports are configurable, so firewall rules should reflect the actual deployment.
The agent must enroll before its first connection. Enrollment provides a unique key for agent authentication and data encryption. Wazuh’s agent communication protocol uses AES encryption by default, with 256-bit keys. Review the enrollment requirements and confirm connectivity from each endpoint to the required services.
Wazuh agents also have an event queue to regulate bursts of data. The default queue holds up to 5,000 events and sends up to 500 events per second, subject to configuration. This is a congestion-control mechanism, not a guarantee that events will be safely retained during an extended network outage. If an agent cannot reach its server, do not assume it will maintain an unlimited, durable backlog. Test interruption and recovery behavior in your environment, and monitor agent connectivity and queue warnings.
CONTAINERS AND CLOUD NEED THEIR OWN COVERAGE PLAN
Container deployments need a clear distinction between monitoring a host and monitoring what runs inside it.
For Docker, Wazuh’s documented approach is to install the agent on the Docker host and enable the Docker listener to collect Docker events. A separate containerized agent or a sidecar that reads shared log volumes may collect selected logs, but it does not automatically provide the same host visibility or Docker API monitoring. Access to host files, container logs, and runtime events depends on what is explicitly exposed and configured. See Wazuh’s Docker monitoring guide.
For LXC, an agent can be installed inside a Linux container where the environment supports it and grants the required visibility. That provides a view of the container, not necessarily the host or neighboring containers. Where host-level monitoring is needed, deploy and configure an agent on the host as well.
Cloud platforms also require a deliberate approach. Cloud control-plane activity and provider service logs are generally collected through provider APIs and integrations, rather than by installing an endpoint agent on the cloud service itself. Cloud virtual machines, however, can usually be monitored like other endpoints.

Network devices (including firewalls, switches, and routers) usually cannot run the Wazuh agent. They need to forward logs, commonly through syslog, or be monitored through another supported method. If a system has no agent, no log forwarding, and no API integration, its activity may remain invisible to the monitoring platform.
A SIEM does not create visibility by itself. Coverage is engineered.
A PRACTICAL DEPLOYMENT CHECKLIST
Before rollout, work through these five steps:
- Inventory agent coverage by operating system. List endpoints, servers, cloud VMs, and containers. Identify systems that cannot run an agent and assign an alternative collection method.
- Design enrollment and groups. Decide how agents will enroll, which teams own them, and how group-based configuration will separate policies for workstations, servers, and specialized systems.
- Size the server and indexer for real load. Estimate event volume and peak periods, not only average activity. Plan for growth and determine whether a single deployment or clustered components are appropriate.
- Set retention before storage becomes the bottleneck. Define which data you need for investigations, operations, and compliance evidence. Align retention with available storage and retrieval needs.
- Test failures and recovery. Simulate a server or network interruption, check agent reconnection and failover, and verify that expected data arrives afterward. Monitor agent status and queue alerts as part of operations.
TURN AGENT DATA INTO USEFUL MONITORING
A deployed agent is a foundation, not a complete security program. Useful monitoring depends on the right data sources, practical policies, alert tuning, storage planning, and people who can validate and respond to incidents.
Cenova Cyber provides managed security monitoring using Wazuh, with deployment support for endpoint and broader environment visibility. Our monitoring combines telemetry collection with alert enrichment, investigation, and response workflows, so your team can focus on risk rather than managing a SIEM alone.
Contact Cenova Cyber to discuss a managed Wazuh deployment or schedule a free security consultation.